
World Olympics Animated Tableau Dashboard
Published:
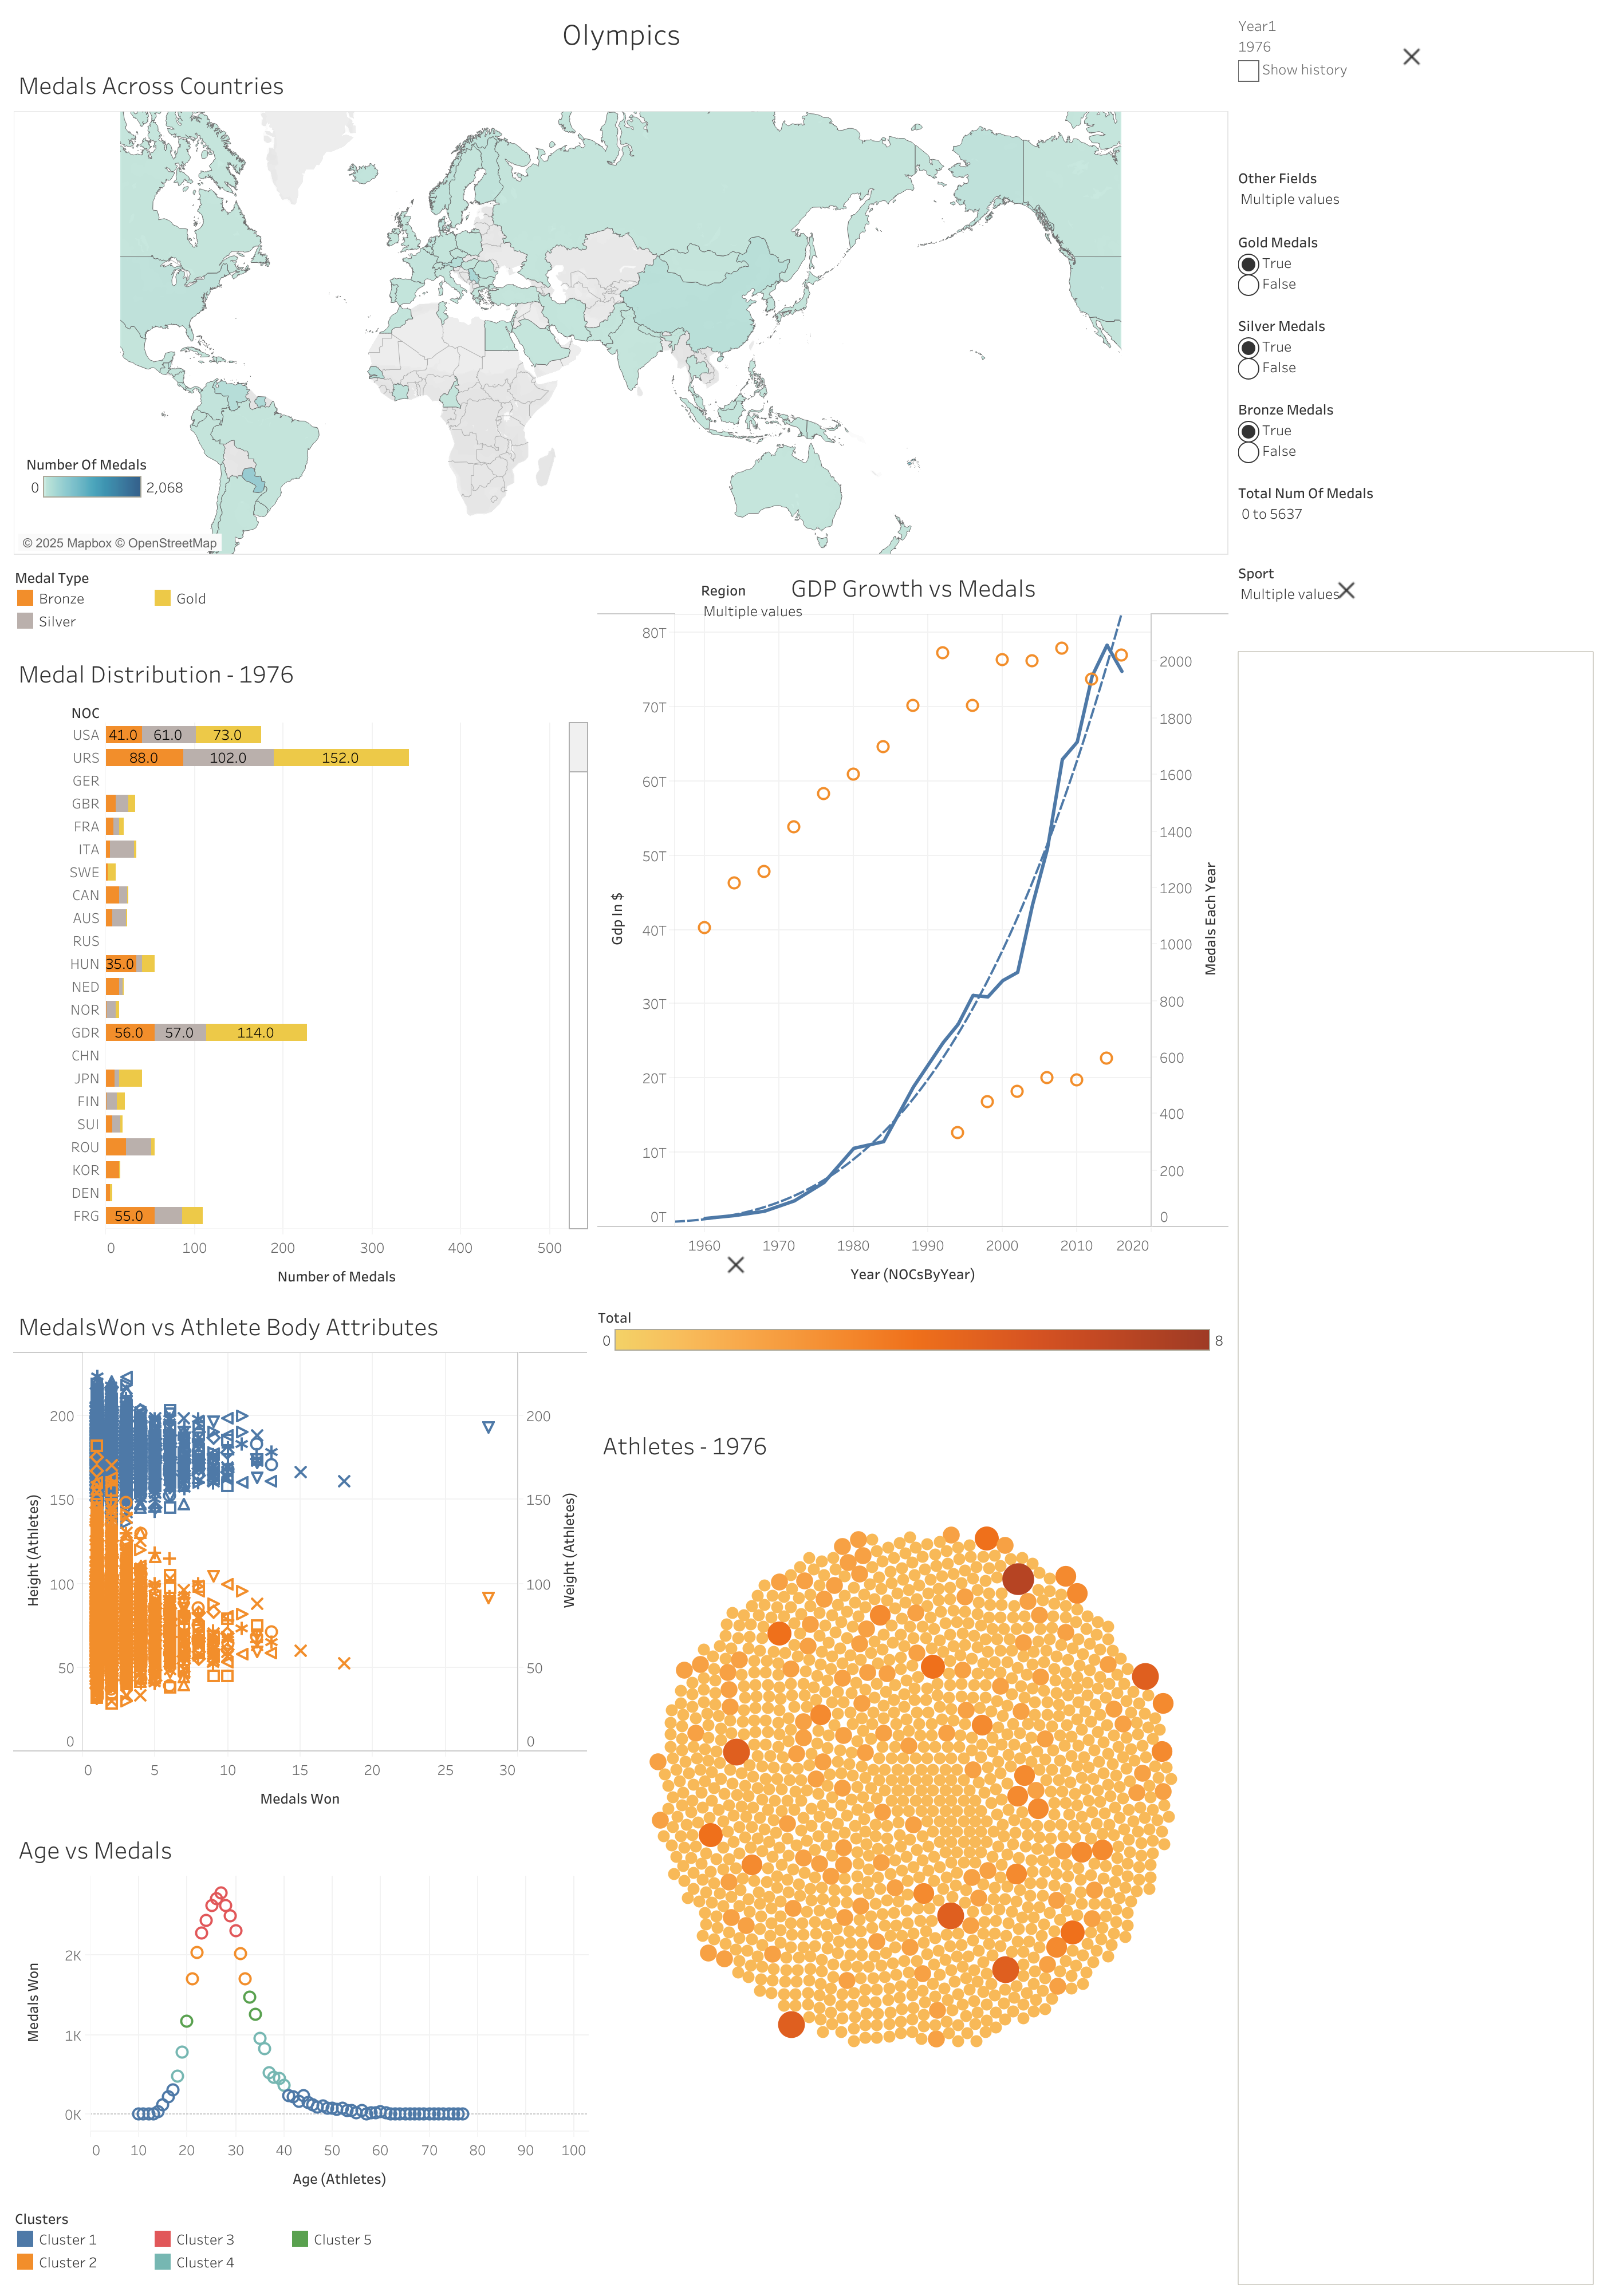
Built an animated, interactive Tableau dashboard to explore Olympic results alongside country GDP over time. The project involved extensive data wrangling, integration, and cleaning before visualization.
Key details
- Cleaned and integrated 270k+ rows and ~80 columns of Olympics and GDP data using Microsoft PowerQuery and Excel.
- Produced 7 interactive chart types and 5 selectors to let users explore medal counts, trends, and GDP relationships.
- Public Tableau dashboard
Notes
- Consider embedding a static thumbnail or an iframe preview on the portfolio page if you want the dashboard to be visible directly on the site.